

 China
China  India
India  Japan
Japan  Philippines
  Singapore
  South Africa
  Sri Lanka
  Thailand
  Colombia
  Ecuador
  Austria
  Denmark
  Finland
  France
  Germany
  Hungary
  Norway
  Poland
  Portugal
  Romania
  Spain
Spain  Sweden
  Switzerland
  United Kingdom
  UAE
UAE  Canada
  Mexico
  United States
 .svg)


A Facebook, Netflix, or LinkedIn implementing chaos engineering is not just injecting failures randomly without an end goal in sight. Instead, this means running planned experiments in a controlled environment to understand microservice architectures and distributed systems better.
But why do we deliberately break things in chaos engineering? How to implement it on a Kubernetes cluster? Let us explore.
Starting with chaos engineering
Microservice architecture is complex: it is vulnerable to unpredictable failures, such as network failures, architectural defects, and application failures. As more microservices come into the picture, there are higher chances of something going wrong, leading to substantial financial losses for organizations.
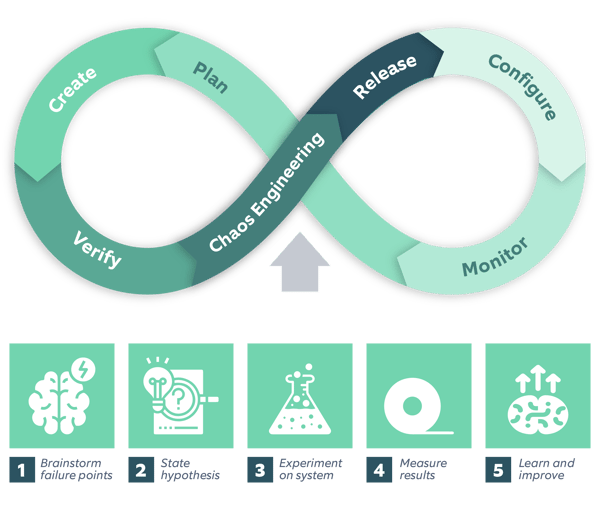
So before carrying out any experiment on your ecosystem, you must:
- Perform brainstorming sessions: To identify the normal state of your system.
- Create hypothesis: To predict how the system will behave once it encounters a particular bug.
- Run experiments: To inject bugs and failures into the system.
- Interpret the results: To identify how the system behaved when you run experiments.
- Learn and improve the functionalities in the existing system from the above experiments and their results.
Cut to the chase: organizations need innovative solutions to help them discover vulnerabilities during build-time. This is when we can integrate chaos engineering with DevOps CI/CD pipelines.
| Do you want to know the steps to create a framework that helps orchestrate chaos engineering smoothly? Check out this blog on DevOps framework to orchestrate chaos engineering. |
Custom solutions for chaos
Coming to tools now. Multiple options are available, but not every tool fits in the standard scenarios. You may customize your tool to meet specific needs concerning your environment.
At Nagarro, we have created an in-house tailored solution that randomly injects failures into the system to test its resiliency.
- No pre-requisites are required to start with this tool.
- Using this tool, we can create different types of attacks in our ecosystem, including resources, network, facility, scalability, and application.
- This tool provides detailed reporting in a PDF showcasing heat maps and a matrix that displays a comparison of the normal system state vs. experimented state for the experiments performed.
Few scenarios that we generate via this custom chaos tool:
- Generate traffic on the network interface of the application to bring in latency in the application and identify how the application behaves under real-time pressure.
- Randomly kill application/database process to test if the system is smart enough to detect it and bring the required process up to minimize the downtime.
- Arbitrarily remove service or deployments of the applications running in the k8s cluster.
- Generate random hits on the application to increase the load on the application to ensure if the system can auto-scale to handle such requests.
- Increase system resources to their full capacity to identify the breakpoints of the system.
- Randomly add application ports in the firewall to detect how the application behaves.
- Abruptly change the OS state or reboot the machine to see how the system behaves when it comes up.
We also have the Reporting tool. This tool provides monitoring via Grafana, where it displays all the metrics that are affected when creating chaos. It collects data from various servers using metric beats and Prometheus exporters to provide meaningful results.
How to implement chaos engineering?
Let us say we have created a Kubernetes cluster. Further, we will deploy an application on the same and try creating latency on the application.
Steps to implement chaos:
For this walkthrough, we will proceed with the following steps:
- K8s cluster with running application.
- Good monitoring setup to visualize how the system is behaving during the time of the experiment. This setup is required to measure the results of your experiments with the actual state of your system. We are using Grafana here to visualize changes in our system since it gives informative visualizations and alerts.
- Tailored automation tool to execute chaos
Step 01: Creating a k8 cluster
- First, set up the environment from UI by selecting the required number of master and worker nodes that you wish to start with.
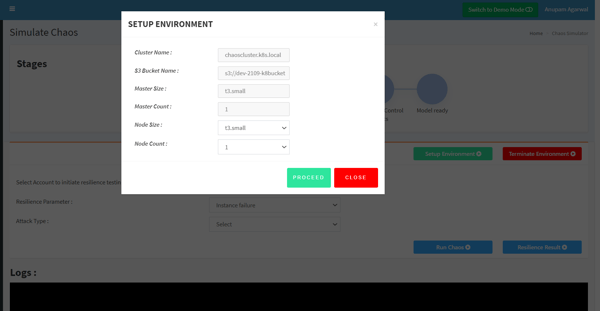
- Once you proceed, it will create a Kubernetes cluster to perform chaos. In the backend, we have created this cluster using Kops on public cloud AWS.
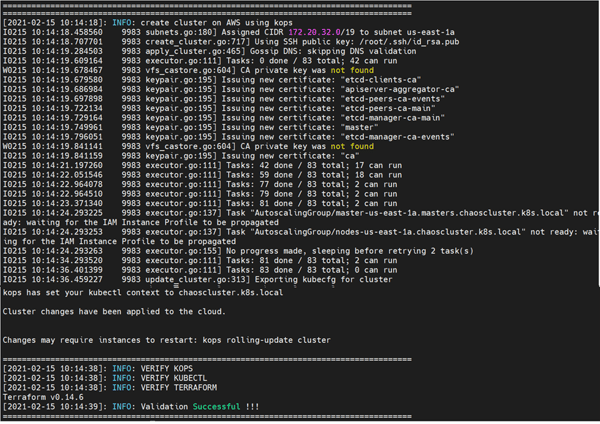
- Next, validate the details of your cluster:
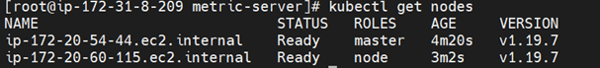
- Once the cluster is up, we will deploy a sample Django application.
- Here is a snippet of application we’re going to deploy, located in the directory, in a file called “app.yaml”:
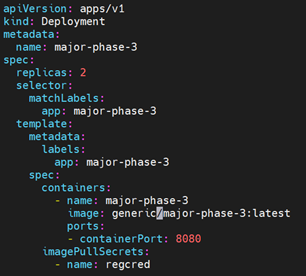
- Once the definition file is applied, the application will be up and running as a Pod.
Step 02: Monitoring the setup
- We will now set up the monitoring tool Grafana and add data sources to collect the data.
- Under normal circumstances, system usage is normal as viewed via Grafana.Step
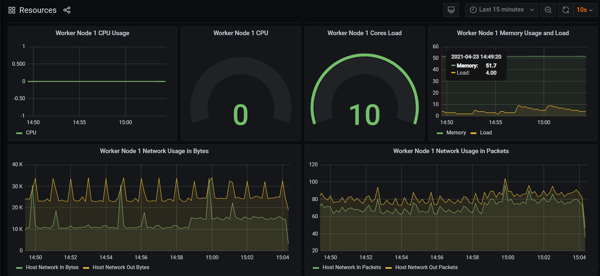
03: Running the chaos experiment
Now let us apply all that we discussed to a real-world example to better understand chaos engineering.
We will now execute chaos on our first scenario to create latency on the network interface where our application is running.
Brainstorming sessions: We all expect our systems to work in a certain way under normal circumstances. So, in this scenario, we expect our application to perform normally and serve the requests.
Creating hypothesis: Where will the system break? This is the stage where you predict how the system will behave under abnormal scenarios.
In this case, we predict whether our application will be able to serve requests at the same pace as it was, before injecting any latency.
Or will the processes grind to a halt because there is not enough memory or network bandwidth left to manage the load?
When we test this hypothesis, the metrics that we are going to monitor will include:
- Overall usage of the node (memory/CPU) where this application is running.
- Impact of latency created on the network interface.
Running experiments: What happened? This is the step where you validate your hypothesis.
Now we will inject network latency by contracting the bandwidth of the network interface where our application was running. We monitor system utilization and network throughput during the test and see where the system fell over.
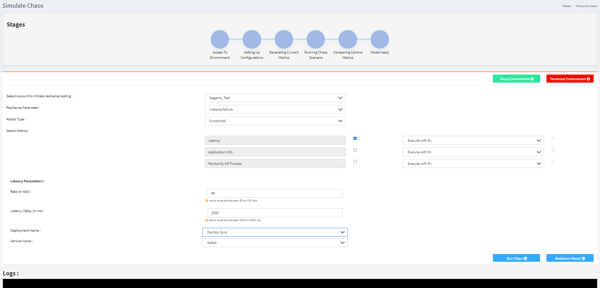
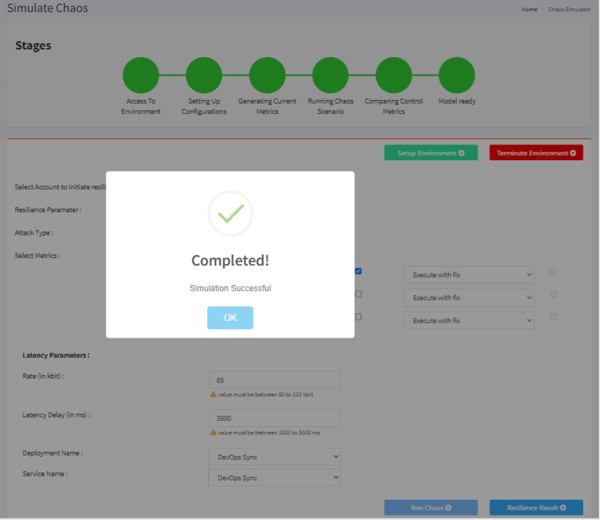
From UI you can select various components like:
- Account on-boarded
- Different types of resilience parameters (instance failure/facility failure/application latency)
- Attack types (functional/infrastructure/both)
- Different metrics
- Select the application name/endpoint where we need to create chaos.
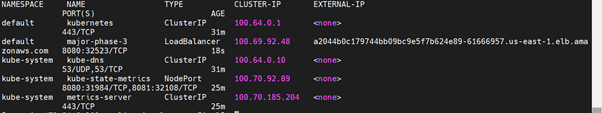
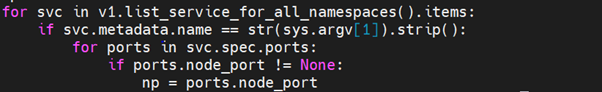
We then define the application/cluster name on which we wish to create network latency. Python script identifies the port on which the chosen application is running.
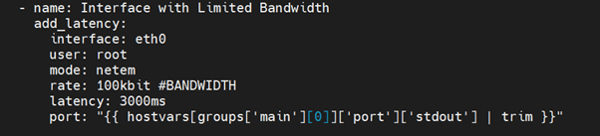
Once the port is identified, ansible playbook creates the required interface latency in the application port using Linux modules Traffic Control (netem) for a certain amount of time.
There are other modules available like messaging asynchronous capabilities to introduce the same effect.
Once you have successfully created the latency on the bandwidth of the network interface of the application, you will see a message like this on the UI:
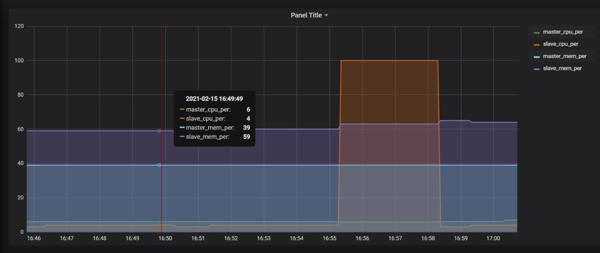
You can now monitor the current state of your system when executing chaos. Grafana will show an increase in the usage of system resources:
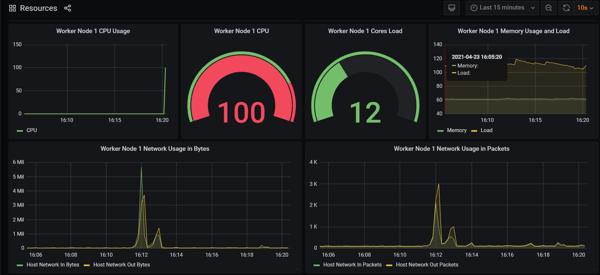
Results: This experiment confirmed that the initial state does NOT match with the desired state.
We created network latency on the interface where our application was running. This increased the delay in response of our application & system resources. The goal of chaos engineering, however, is to find weak points in our clusters. So, we normally start defining a steady state that we test before and after an experiment.
You can also view the Heat Map generated, which shows the system behavior at normal state vs. experimented state.
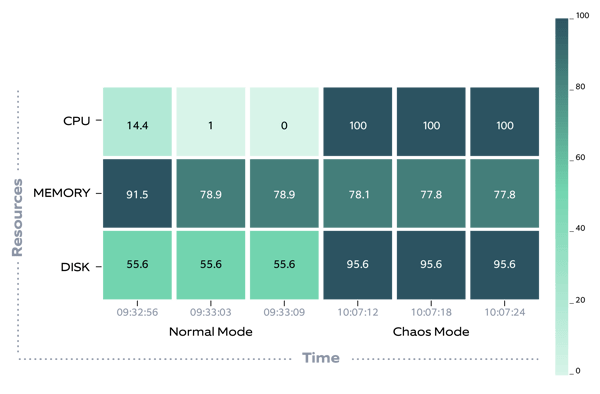
If the state is the same before and after, we can conclude that our cluster/application is fault-tolerant for that case.
Learn and improve: The above experiments and results help in improving the functionalities in an existing system making it more robust and resilient.
Once you have improved your system, you may re-run the experiment.
When executing the script with a fix, the script releases the latency created on the network interface as soon as it detects that any such latency is making our system behave normally.
So, we effectively created network latency on the port where our application was running, and we worked on its fix to get our system up and running under such a situation.
Conclusion
We all expect our system and applications to behave in a certain way, i.e., we have specific benchmarks that our system should meet in all odd conditions. We all know that 100% uptime of critical applications is impossible, but the goal here is to be online as quickly as flipping a light switch.
Chaos engineering helps you understand unexpected behavior in your ecosystem and get insights. You can then accordingly design your system to make it fault-tolerance and more resilient.
Do you want to ensure a structured chaos engineering discipline within your organization? Our experts can help you—explore our offerings and get in touch with us today!
.jpg)
