Christian%20Dusek%20(1).jpg)
Thomas Riedl
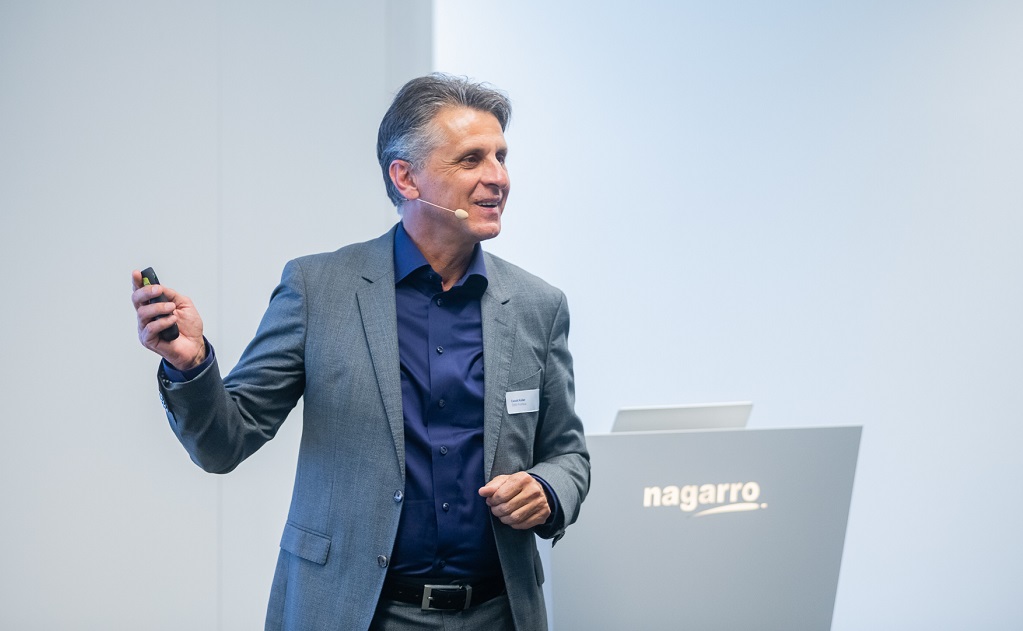
Nagarro has been working closely with ÖBB-Postbus in the field of innovations, for several years now. At the first Nagarro Turntable event, Ewald Koller (Head of Technology at ÖBB-Postbus), told the audience about his first large data project that was implemented in collaboration with Nagarro. Due to the great interest in the project, I asked him to share his personal experiences in the form of an interview with our blog readers. Read on to know his thoughts on unplanned cancellations, ways to avoid them, artificial intelligence, and his data journey.
Mr. Koller, the credo of ÖBB-Postbus is satisfied customers. How do you achieve this every day?
We want people to travel as smoothly as possible and reach their destinations safely. Every passenger should connect Postbus with a comfortable and on-time ride. We must, therefore, avoid unplanned cancellations as much as possible in advance.
Can we use new technologies to avoid such outages?
Since 2013, the entire Postbus fleet has been equipped with a vehicle data system to continuously monitor the condition of buses to ensure that the fleet is properly used, managed, and maintained.
The driver light, for example, is a software with a four-color display installed on the dashboard of the driver. It provides real-time information about the "condition" of the vehicle. This data on the condition of the vehicle such as idling times, brake wear, and engine speed, is sent to a central server. This is documented and saved for possible analysis. Such data is also useful for preventive vehicle maintenance.
The analysis from the vehicle data system is helpful, but we are convinced that our service times can be optimized further, using modern analysis methods.
What role does Artificial Intelligence (AI) play in such an analysis?
The idea behind the concept of using AI is to understand captured data better and identify patterns that might lead to the actual cause of certain vehicle problems. Is it possible to identify a problem before it occurs? If so, this could help us reduce downtime and increase service time. As we can already see international examples of successful predictive maintenance projects, we are very optimistic about AI.
Sounds reasonable. And how exactly can our readers envision such an approach?
We try to identify variables that have a certain correlation and perform a what-if analysis. We want to understand whether there are correlations between problems and symptoms. Nagarro has helped us a lot.
At what point did you start this extensive journey?
Nowadays, the right data is more valuable than gold. We have given the Nagarro team access to an enormous volume of data, asking them to search for specific correlations.
This involves three main types of data:
Type 1 - Streaming data from about 22 vehicles, from 2015 to 2019: These raw sensor data contain information like date and time and were used earlier, to monitor the condition of the vehicles.
Type 2 - The data on all the information about breakdowns that occurred in the vehicles during the period mentioned above. This data allows the team to compare the raw data with the malfunctions that occurred.
Type 3 - The data for the repair details of the respective vehicle. This is used to ensure that the correct defect has been identified as per the information available.
Did you come across any gold in "data mining?"
Yes, it has turned out that a low generator voltage over a longer period results in this generator failing. This concrete conclusion could not be used for an error prognosis, because the time-distance between trigger and error is too short. However, we can still use this knowledge for operative optimization. It is important to find the cause of the low generator voltage. This gives us a concrete starting point to prevent an imminent failure in future because we can eliminate the reason behind such failures. We are working on detecting anomalies much earlier.
That sounds promising. Were there any other findings within the scope of the project?
No. Another interesting outcome is that vehicular components that are not interrelated can still cause mutual failure. With the help of a correlation matrix, we can ascertain when component 1 will fail and how long it will take till component 2 fails. If such interdependence is safeguarded, the failure of the second component can be prevented in the future by proactive repairing measures.
Did this "search for gold" pay off, in your point of view?
In a nutshell, this project gave us many useful insights. But this is only the beginning of our data journey. We have taken the first step and have already gained valuable insights. I am absolutely convinced that further improvements can be realized.
 What would you advise all such companies who would like to start a similar journey?
Such a data journey is long, requires a lot of patience, and often resembles an experiment. Not all results are useful, but even there, we do get to know the direction in which we do not need to think further. The proper path becomes clearer and more transparent, and eventually, all our patience becomes definitely worth it.
What do you see at the end of your data journey? As this journey has only just begun, I cannot say as yet about where or when or even if it will ever end! Maybe we will come across further, still unknown correlations, which in turn, can offer solutions to other problems. I think that there is still a lot to discover, and we consider Nagarro as our ideal partner in this journey.
Well, I'd say we both see it that way! 😊 Thank you for sharing your insights with us, Mr. Koller!
Related Links:


