China
China  India
India  Japan
Japan  Philippines
  Singapore
  South Africa
  Sri Lanka
  Thailand
  Colombia
  Ecuador
  Austria
  Denmark
  Finland
  France
  Germany
  Hungary
  Norway
  Poland
  Portugal
  Romania
  Spain
Spain  Sweden
  Switzerland
  United Kingdom
  UAE
UAE  Canada
  Mexico
  United States
 .svg)


Let me start with the obvious: Organizations need to understand data and must know how to extract, market, and construct their strategy around it. Clearly, one cannot emphasize enough on the importance of data in this information age.
- The significance would increase in the post-pandemic world where changes are expected across various sectors. For example: In supply chain, the procurement of consumable goods might be based on the health report of supplier
- Product pricing might be based on location
- Purchase interaction between sales agents & consumers might become completely online
Organizations that have already adopted Business Intelligence (BI) certainly have a competitive edge in measuring the ‘degree of change’ & the ‘impact’ of the changed processes to their bottom lines.
If you are looking to implement BI, this blog can help you with a structured approach to do so. Here are the 3 most important factors of BI implementation:
#1 Be flexible in choosing the delivery method
In the initial days of development, the team is busy acquainting itself with new tools, to understand the existing technical landscape. Therefore, predicting the delivery of a working software becomes a challenge. Here is how you can make your choice, based on what suits you best:
1. Scrum: Scrum is the most widely-adopted framework across organizations, with 54% of agile projects using it. Sprint is the heart of scrum; sprints are iterative and incremental; they are protected, time-boxed, and the commitment to complete ‘X’ number of story points is made based on the team’s capacity.Scrum as a framework works well when

Now, many agile enthusiasts would think that working software can be delivered sprint-by-sprint, but when BI-based products are delivered, stakeholders generally like to see a trend. They want to see a flow of information from top-to-bottom and then decide on the right product.
When can Scrum not be your best bet?
Scrum, as a framework, might not work while implementing BI for certain situations:
a) Chart/Graph Type is not clear- Group: A smaller stakeholder group
- Situation: The stakeholders look at the data for the first time and decide what type of trend they would eventually like to view. For example, should we look at data of only last year or should we see a trend in the previous 10 years first and then have a drill-down for yearly comparison?
- Effect: Frequent changes in design and previous effort goes down the drain.
- Group: A bigger stakeholder group comprising members from various departments (finance, marketing, sales, operations, etc.)
- Situation: All departments are consuming the same dashboard. Each department has its own interest area and wants to view metrics that measure performance for their business unit. In such situations, it becomes a challenge to find consensus as a big group can have different goals and expectations.
- Effect: A new KPI might get discovered in the middle or perhaps during the project’s end-phase. Then, the entire dashboard will have to undergo an architectural re-design.
- Group: Multiple stakeholder groups, consuming different dashboards/reports
- Situation: Each stakeholder group has at least one or more top priority items, and product owners keep raising urgent requests in the middle of a sprint. The real challenge is to prioritize if multiple requests with similar priorities are pushed at the same time. Even after prioritization, there might be a request which gets cancelled before the delivery takes place.
- Effect: Stakeholders start losing trust and move back to the old ways of data crunching.
- Group: System architects
- Situation: In the initial days, the focus is to pull numbers, derive a KPI that stakeholders want, but only from a sample dataset. When the last 10 years’ historical data with millions of rows is required, the scrum team needs to stretch for performance tuning. Stakeholders expect a feature-rich product with slice & dice and drill-up & drill-down functionality.
- Effect: Expectation management becomes tough with each day, leading to a possible delay in MVP delivery.
- Kanban is well-suited during the initial days of the project (also called the discovery phase), where the team is going through a learning curve. Let’s take an example, during the discovery phase, the team is performing tasks such as understanding the dataset, taking access for an existing database, setting up data lake, installing a new application on servers, setting up the ETL process, etc.; it becomes easier to pick a task based on the availability of the required infrastructure as well as the stakeholder. Using Kanban, the development team would always have something to be picked from the backlog on a day-to-day basis.
- Kanban is also suitable for situations like the support & maintenance cycle of a project, where a small piece of work requires about 1-2 days of effort.
3. Scrumban: Scrumban, as a framework, takes the best of both worlds, i.e., planning from scrum and flexibility of Kanban. In Scrumban, all ceremonies are similar to the scrum such as sprint planning meetings, daily stand-ups, sprint demos & retrospective meetings. It also facilitates frequent changes in your current sprint like Kanban. Another attribute of Scrumban is that the team is not grilled for committing and delivering the planned story points. In this framework, new items are welcomed during a sprint, and planned items can be de-prioritized or even dropped due to any change in business dynamics.
- In a project where BI is involved, sometimes stakeholders must make a quick decision and might not wish to wait till the end of a sprint to review the report or dashboard for any necessary action. This means that a high-priority item can be picked anytime when using Scrumban.
- For situations involving a huge number of stakeholders, data analytics requests can be raised anytime, irrespective of the phase in a sprint cycle (during the early, middle, or the last days of a sprint). In such cases, it is important to do a proper requirement gathering exercise and understand the availability of data before delivering a story. One can create spikes for R&D and can also create technical tasks before starting any story requested by the respective team.
#2 Create a culture for self-service analytics
The role of leadership in implementing BI is very critical for an organization. The leadership team must ensure that once the new BI-related tools are in place, the organization should be able to perform analytics. If we look at the implementation of a new application such as ERP or CRM system, there is always a dependency on the IT (development) team to code and deploy. In the post-production phase, the dependency is on IT (support & maintenance) to fix any issue, which might take anywhere between 1-3 days. But, some things need a quick turnaround. In the world of BI, if the lead time for any change is 3 days, then there is a high probability that you might miss the bus.
Can we imagine a culture where the business team is creating their report or dashboard without any dependency on the IT team?! YES, this is possible with self-service analytics.
In self-service analytics, you can choose:
- The data point which needs to be plotted
- The time-period (date)
- The dimension/filters applicable
- Apply available formulas or create a formula and then prepare a report or dashboard
Let us take a use case of a publishing house, where a revenue comparison between various genres is required. A member from the business team is looking at an interface, where all the sources are available. After pulling the data from sources, the member can select data points or filters to create and share the dashboard. The following image depicts the steps that a business owner/team member can take to create a meaningful dashboard.
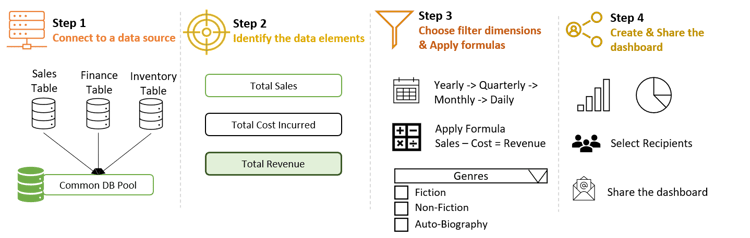 Steps to create a meaningful dashboard
To promote and empower employees to perform self-service analytics, you can do the following:
- Create a common community of database experts, analysts, and business experts for collaboration
- Incentivize content creation to enable colleagues to use these tools frequently
- Launch reward programs such as Hackathons, where business teams can collaborate and explore a new way of looking at data
- Design a dashboard where people can collaborate with designers to create a more impactful dashboard, and other such exciting programs which motivate employees to participate actively
From an infrastructure point of view, there are 3 main components, which would act as enablers in creating such a culture:
- Datawarehouse or Data Lake: Organizations have loads of data coming from various sources (such as CRM, ERP, SAP, and salesforce system, or existing repositories of data, etc.); data warehouse/data lake must be established as a single source of data. There are several such tools in the market, such as Azure SQL database, PostgreSQL, MongoDB, Amazon Redshift, Oracle Data Warehouse, Snowflake, and many more.
- ETL layer: Once the tool is selected, the next step is to create an automated process of loading data into this common pool. There are various ETL tools for this, namely IBM InfoSphere DataStage, Pentaho, Azure Data Factory, Hevo Data, Informatica PowerCenter, etc.
- Visualization & reporting tool: This is the most crucial element in creating a self-service culture, as this would become the interface for employees to create reports and dashboards. There are various visualization tools such as Microsoft Power BI, Qlik Sense, Domo, Tableau, Pentaho, etc.
#3 Storytelling through visualization
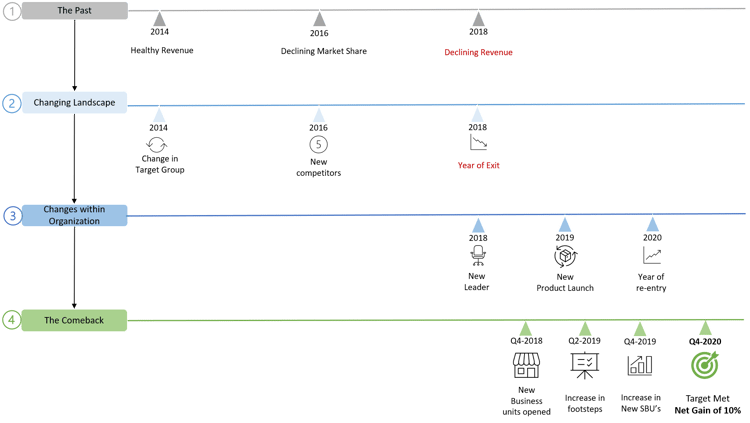
Visualization of data, which would be consumed by leaders and stakeholders, needs to be done in a way that the audience can relate, understand the pain points and causes, and start having a conversation to find a solution. Visualization should present the big picture: take the audience through the journey traversed together and present the current situation. Let us say the story’s title is ‘Redeeming a lost market’, and the story has many smaller, relatable chapters. Consider figure 1 below, where a business stakeholder is trying to orate a story through facts and graphs (in figures 2 and 3 below).
Figure 1 answers the “what” part of the story that the business stakeholder wishes to communicate with the audience.
Figure 1:
 *figures are for illustrative purposes only
- What happened: Our organization was present at multiple locations, and in the year 2018, we had to exit from the market.
- Why it happened: The market dynamics were changing, the target segment which yielded maximum revenue was changing. The shift started in 2014 as we saw entries of new competitors, and we had to exit in 2018 due to external factors.
- Changes in the organization made as ‘corrective measures’: Looking at the declining sales and revenue of the past 2 years, the Board of directors roped in a new CXO. The new leader came with a purpose and a target; he launched new products in the same market, and by 2020, we were back in the ‘lost market’.
- The Comeback: Now, since there is a history of why we are looking at this story, the more interesting part for our audience is to see the actions taken by the new leader. Highlight the key areas which enabled the comeback such as opening new touchpoints, increase in footfall, and new strategic business units (such as stores & warehouses) or any other.
Figures 2 and 3 answer the “how” part of the storytelling
Figure 2:
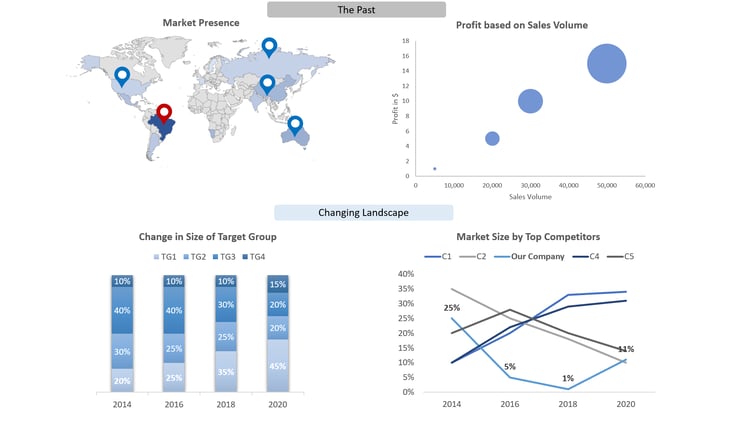
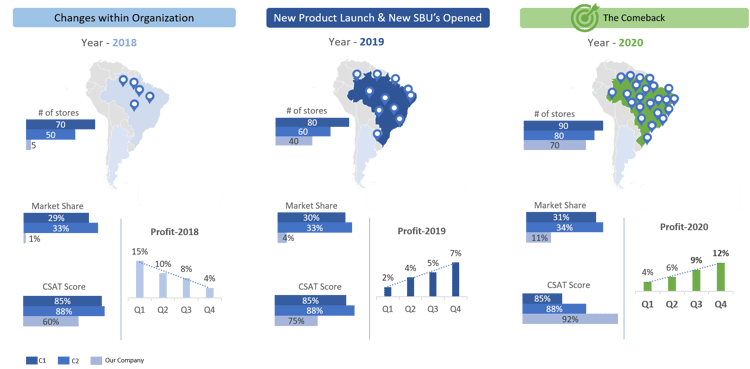
Figure 3:
 *figures are for illustrative purposes only
- To show the past, the following graphs are used:
- A geographical map, where geo-locations display the global presence and a red-colored pin location displays the market which was lost.
- The second chart depicts that to sustain in this market, one needs to achieve huge sales volumes to make a reasonable profit.
- To show the changing landscape, 2 different graphs are used:
- The first graph shows that the Target Group (TG) size grew from 2014 to 2020 i.e., TG1 grew from 20% to 45% and TG4 also increased by 5% in these years. This data point would have been used in 2018 & 2019 by the new leader and might have been used to chalk-out the new strategy.
- The second graph shows the change in the competitive landscape amongst 5 competitors. This graph brings out that Competitor1 (C1) took a huge leap when our company was exiting and remained the market leader till 2020. Another competitor (C4) grew in this period and is currently second in terms of the captured market size.
- While changes were made in the organization, the following KPIs were used to depict the position of the company in 2018:
- A geo-map, showing a limited number of stores left as partners
- Comparison of the following data points:
- Our market-share as compared to the top 2 competitors/market leaders
- Customer Satisfaction Score (CSAT)
- Falling profit percentage, quarter-by-quarter, in 2018
- The comeback was shown from 2019 to 2020: In 2019, the company saw an increase in all these KPIs:
- In 2020, a contrasting and positive story is told, where although the company was lagging in terms of market share and number of stores, it was leading in terms of customer satisfaction. This will make the audience believe that the newly launched products and the new strategy of having more touchpoints near the shores/docks proved beneficial.
- The target of 10% net profit was crossed by the 4th quarter of 2020.
In the above story, we have conveyed the message that a market was lost and how the company redeemed its lost market.
Now, it is important to determine the factor of ‘redemption’. If you look in detail, the key factors were:
- Plotting a chart indicating that the market is still worthy of investment, as competitors made sales
- Comparing the number of stores (to measure presence), market share (to see any increase/decrease in share)
- CSAT (to measure the customers’ sentiments towards a brand)
These factors help an organization to decide how it can increase its revenue further. In the end, the audience leaves with a happy note as they ‘re-lived’ the journey and also ‘discovered’ a new path towards another new journey.
Conclusion
Relevant data is indispensable for informed decision-making. To present the relevant data, one needs to build an engine - an engine that consisting of many parts such as understanding the type of analytics to be performed and the business KPI’s, deciding the tools to use based on the size of the data and number of legacy systems in your organization.
Once the engine is ready, be flexible about changing gears. One may choose to start with Kanban, switch to Scrumban or Scrum, or any other methodology. Many people say that to drive a car, one needs a good driver. In case of BI, the driver is the story your data is eliciting, and while the audience consumes this story, they might go back in that memory lane or have a déjà vu or have a visionary moment to make the quantum leap.