China
China  India
India  Japan
Japan  Philippines
  Singapore
  South Africa
  Sri Lanka
  Thailand
  Colombia
  Ecuador
  Austria
  Denmark
  Finland
  France
  Germany
  Hungary
  Norway
  Poland
  Portugal
  Romania
  Spain
Spain  Sweden
  Switzerland
  United Kingdom
  UAE
UAE  Canada
  Mexico
  United States
 .svg)


Do you sometimes wonder why your application(s) is experiencing incidents in production? And what could be that missing factor that, when implemented, can help reduce them?
Picture this: Your application experiences a sudden outage, significantly impacting customer experience and thus impacting your business. While you can access the data that touches upon what went wrong with your application, you need insights into how and why it happened. Without complete visibility into the application performance, there is no way to know what, where, and why of the failure, making it tough to make your system resilient.
It's ideal when you have complete visibility of the data that helps make informed decisions and shapes your infrastructure, architecture, application and storage systems to be more robust, reliable, and resilient.
You may monitor your systems and critical metrics regularly, but you can take it a notch up by implementing observability and building a highly available and resilient system.
Wondering why and how? Let’s explore!
But first, what is observability?
As modern distributed systems grow more complex, you must understand your system's behavior, performance, and internal state. This is, in simple terms, observability.
It is an essential component for building resiliency in a system. It is an approach to derive details on the system’s internal state by making data (e.g., metrics, logs, events, and traces) available for continuous monitoring in order to gain valuable insights and make well-informed decisions.
Does that sound familiar to monitoring? Let’s see how observability differs from monitoring by evaluating where you are on your journey.
Monitoring v/s Observability
You may currently monitor all your systems and applications by deploying solutions like New Relic, Splunk, Application Insights, etc., that help you configure dashboards for predefined metrics, set up periodic health checks, track error budgets, trigger alerts by predefined thresholds, and so on.
By all means, these solutions help monitor your system by checking the system’s output/status.
On the other hand, observability goes beyond monitoring a system’s status to measuring its health/internal state based on the external output.
For example, in monitoring we ask questions like:
- ‘Is the process working fine?’
- ‘Is the system meeting its SLAs?’
Observability, in other ways, lets you ask questions like:
- ‘Why is the system not working?’
- ‘What services are being called when a user performs a particular action in the system?’
- ‘How did each microservice process a request?’
Monitoring can be called a subset of observability. Here are a few examples to help you understand the difference in a simplified way:
.png?width=620&height=235&name=monitoring-vs-observability%20(1).png)
So, is monitoring enough?
No, monitoring is definitely not enough, especially when you depend on contextual data to make key business decisions. Moreover, in microservices, multi-dependencies, and an ever-growing reliance on the cloud, traditional monitoring falls short in understanding and identifying when an application/service experiences failure or acts in a way that isn’t expected.
To deliver the ‘it just works’ experience continuously and effectively, we need observability to provide insights that help us improve the system’s resiliency.
With an intuitive dashboard that showcases what’s happening in real-time, observability helps:
- Monitor the performance of an application.
- Identify root-cause of an issue and the impact of a failure attack on the application.
- Provide readily accessible information.
- Drive informed decision-making.
Observability is crucial for maintaining the performance and reliability of the modern systems.
Pillars of Observability
Now that we are privy to the importance of having observable systems, let’s quickly look at the key pillars of observability – events, metrics, and instances.
- Events: They are immutable records of discrete events that happen over time such as system and server logs (syslog, journald), firewall and intrusion detection system logs, application, platform, and server logs (log4j, log4net, Apache, MySQL, AWS), etc.
- Metrics: They are numbers describing a particular process or activity measured over intervals of time. Such as system metrics (CPU, memory, disk), infrastructure metrics (AWS CloudWatch), web tracking scripts (Google Analytics, Digital Experience Management), application agents/collectors (APM, error tracking), and business metrics (revenue, customer sign-ups, bounce rate, cart abandonment).
- Instances: This is the data that shows for each invocation of each downstream service, which instance was called, which method within that instance was invoked, how the request was performed, and what the results were. Specific parts of a user’s journey are collected into traces, showing the services invoked on which containers/hosts/instances were running on, and the results of each call.
Notably, just access to events, metrics, and instances doesn’t necessarily make systems more observable. There are powerful tools that, if implemented well, can help unlock the ability to build better systems. So, you need to take the next step of implementing an observability solution.
An Observability Solution
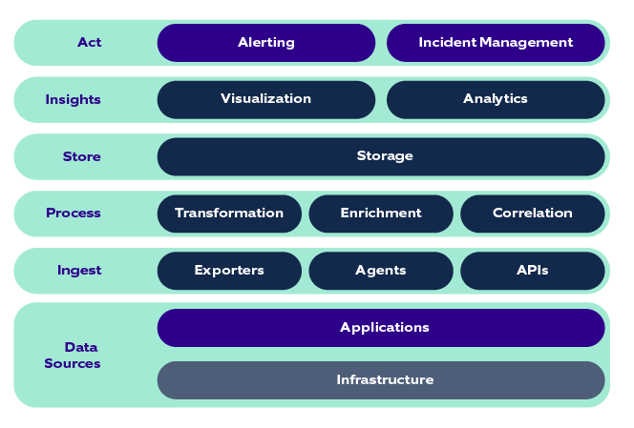
The starting point of observability is the collection of raw data such as metrics, logs, and events from different sources, such as applications and services that run on different infrastructure. This data must be efficiently ingested into the observability platform through pipelines before being used collectively. This can be done through various mechanisms, such as collecting agents, log exporters, or APIs.
This collected data then needs to be processed, enriched, transformed, and correlated to provide further meaningful insights. This processed data must be stored optimally that can be used for querying and presented in dashboards and visualization tools to identify trends, outliers, and other valuable insights regarding systems health and performance. Alerts and notifications can be sent out to appropriate teams to act upon based on predefined thresholds or conditions. The observability architecture often integrates with incident management platforms and other automation frameworks for enhanced incident response.
These are the building blocks of an observability solution:
Listed below are a few key steps to improve observability:
1. Define SLI/SLO of the identified critical services
SLIs (Service Level Indicators) and SLOs (Service Level Objects) are critical components in managing and measuring the performance of services. SLIs are measurements of specific aspects of a service's performance, such as response time or availability. SLOs are the specific targets that the service needs to meet concerning those indicators.
For example, SLI for a web application can be response time, while the SLO can be set at less than 200 milliseconds for 99.9% of requests. Similarly, SLI for a database service can be query latency, while the SLO can be set at less than 5 milliseconds for 99.99% of queries.
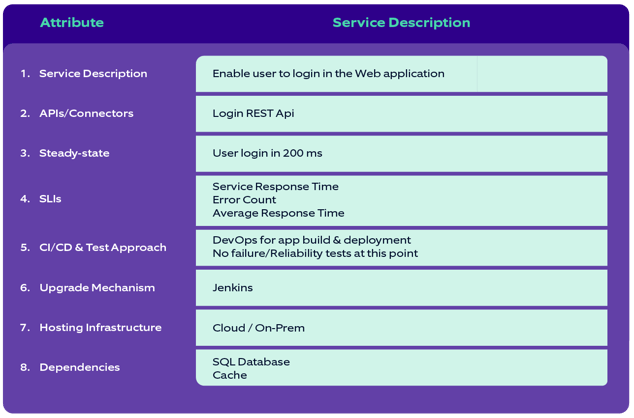
2. Create a detailed service catalog
A service catalog is a resource asset to capture the details of services we want to observe. It can be created like the below reference image:
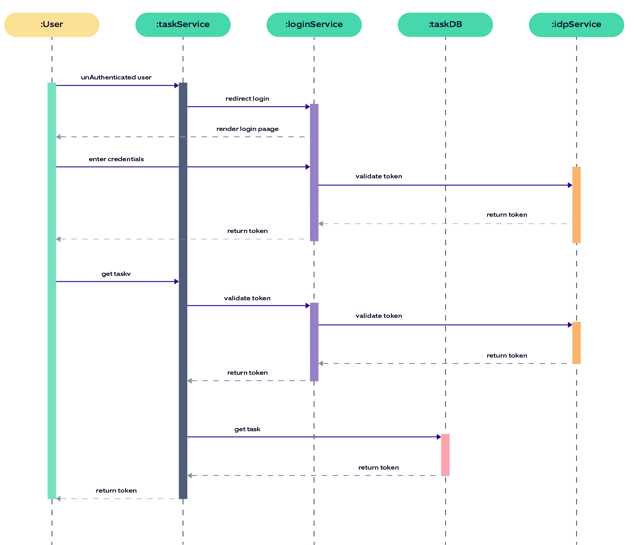
3. Designing a sequence diagram of service interactions
A service diagram will help you get a comprehensive view of trace data as a request travels through the system. Here’s a sample service integration diagram for login service:
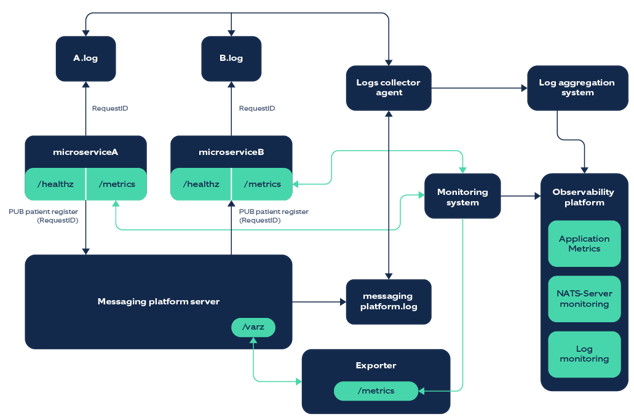
4. Creating an Observability Architecture
An observability architecture will help define the steps to make the system observable.
As an example, let’s assume that we have a solution with two microservices that communicate with each other using a messaging platform. The diagram given below shows how we can implement observability for such a solution:
5. Building an intuitive Observability view
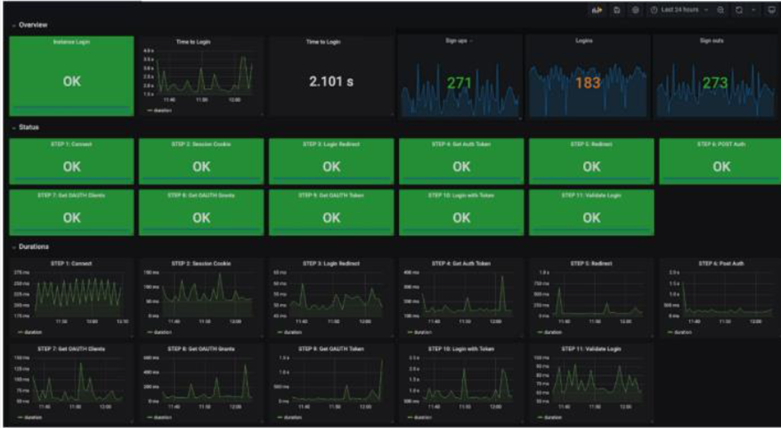
Build a dashboard that provides an overview of the entire system by grouping charts and visualizations of metrics. Here’s a Grafana custom dashboard curated for one of our projects:
By following these steps with the help of an expert, you can start building observability into your system and improve resilience over time.
Nagarro’s expertise
Applications can fail in production for various reasons – known or unknown. At Nagarro, we help you make your applications observable and provide answers to questions that make your systems reliable and resilient. We set up the right observability solution leveraging your existing tooling and infrastructure and provide the best next steps required to generate insights to make your systems resilient and reliable.
Get in touch with us today.