

 China
China  India
India  Japan
Japan  Philippines
  Singapore
  South Africa
  Sri Lanka
  Thailand
  Colombia
  Ecuador
  Austria
  Denmark
  Finland
  France
  Germany
  Hungary
  Norway
  Poland
  Portugal
  Romania
  Spain
Spain  Sweden
  Switzerland
  United Kingdom
  UAE
UAE  Canada
  Mexico
  United States
 .svg)

In the first part, we discussed the basics of agile metrics - story points, velocity, and release planning. Part two deals with the possible ways to determine the progress during a sprint and shows the advantages and disadvantages of the different measurement methods.
Progress in a sprint – An overview
During a sprint, progress can be measured in three ways:
- Number of tasks to complete/completed tasks
- Sum of story points to achieve/story points achieved
- Estimated open efforts
The representation takes place as a Sprint Burndown chart. The form of representation is the same for all variants. The X-axis shows the time course for each day in the sprint. The Y-axis represents how much is still open in the sprint backlog.
All we need is a flipchart, which we update daily. The Scrum Burndown chart helps the scrum master to track sprint performance in real-time, and also check the agility of the team.
An experienced team takes a critical look at its scrum board and evaluates whether the sprint target can still be reached. But for many, it is helpful to get this information, supported with a graphical representation. For a scrum master, it is, of course, also of interest to collect data that can help to learn more about the team's way of working.
1. Number of tasks to complete/completed tasks
Planned tasks should neither be too large nor too small. A suitable size is if they can be completed within a day. Measuring sprint progress based on scheduled and completed tasks is a simple approach that still gives you a lot of information.
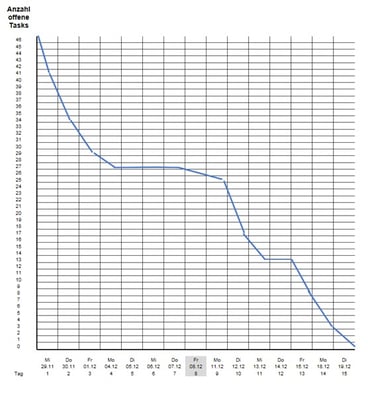 Example: Open tasks in a sprint
Advantages:
- We get a continuous curve of the completed activities.
- The representation of tasks is more meaningful than that of story points - we recognize when the team was more agile and when not as much. Was the start-up phase long? Did the progress stagnate suddenly? Is there a recurring pattern at the end of the week?
- It is easy to assess whether the sprint target is still achievable.
- The information is easy to determine. By counting how many tasks are hanging on the scrum board as "not done yet,” we can set a corresponding point on the flipchart and draw the line further.
Disadvantages:
- Tasks are not always equally comparable; nevertheless, the tendency of the team is well recognizable.
When to apply?
- If we want to analyze the course of the sprint in detail.
- If we want to know more about whether the tasks have a senseful size. Are they defined too inaccurate or too detailed?
- If the team takes too long to implement the first stories.
- When, after a good start, things don't go well (less productive phases).
- When the goal is to achieve a continuous flow of completed tasks.
2. Sum of story points to achieve/story points achieved
The measurement criteria are the story points planned in the sprint.
Advantages:
- We get a curve of the completed stories.
- We do not need a second measure of the progress.
- The values are easy to determine. We add the story points of the user stories not finished on the scrum board, set a corresponding point on the flipchart, and draw the line further.
Disadvantages:
- The measurement method is coarser than the number of tasks still open or the remaining effort.
- It is less meaningful during a sprint because it can take tests or test automation to complete a story, and it is less transparent than the other two methods whether there are idle times in the team phase of a story.
- Tip: You can use a cumulative chart that shows the progress of status transitions; of course, this is also more time-consuming.
- Compared to the other two methods, it is less easy to assess whether the sprint target can still be reached.
When to apply?
- If we want to focus on completing stories (stop starting, start finishing).
- When we need to work on stories one after the other (continuous flow of finished stories and not work on many at the same time).
3. Estimated open efforts
We estimate the open effort in person days or hours and continuously adjust our estimates.
Advantages:
- We receive a detailed curve with the information on how much effort is still open.
- Fluctuations and changes during a sprint are visible.
- It is easy to estimate whether the sprint target is still achievable.
Disadvantages:
- Determining the values is time-consuming.
- We get an apparent accuracy that is as meaningful as conventional estimates.
- Can the team estimate the efforts accurately enough? Does the effort pay off concerning the benefits of the approach? Is the team still working together to achieve the sprint goal, or is everyone just trying to keep to their estimate?
When to apply?
- If we do not reach sprint targets, we improve the assessment of the sprint target and the activities necessary to achieve it.
It also depends on the team and the environment which of the variants you choose. According to the principle "Keep It Simple and Stupid," I prefer option 1, counting and displaying the still open tasks; this is partly also a matter of taste.
Share your experiences of how you have chosen the right agile metrics for your teams with the author at blog.at@nagarro.com.
To understand how to build agile teams, read our blog on Top 10 factors to build high-performing agile teams.
.png)
