

 China
China  India
India  Japan
Japan  Philippines
  Singapore
  South Africa
  Sri Lanka
  Thailand
  Colombia
  Ecuador
  Austria
  Denmark
  Finland
  France
  Germany
  Hungary
  Norway
  Poland
  Portugal
  Romania
  Spain
Spain  Sweden
  Switzerland
  United Kingdom
  UAE
UAE  Canada
  Mexico
  United States
 .svg)

Anyone who has worked in an agile setup knows about one of its key principles: Working software is the primary measure of progress. Yes, it sure is.
However, it should not stop us from using other metrics to check and represent a team's progress. Are there any viable options? What do we need to keep in mind?
With these thoughts in mind, I have blogged a two-part series, to summarize some of my most important and practical observations as a Scrum Master.
Part 1 deals with the basics, story points, velocity, and release planning.
In Part 2, we will discuss the possible ways to determine the progress during a sprint, especially the advantages and disadvantages of the different measurement methods.
Basics
Story Points and Velocity are now well-known terms. Story points are abstract sizes, based on the Fibonacci series: 1, 2, 3, 5, 8, 13, 20, 40, 100. Velocity shows the number of story points that a team has been able to implement within a sprint.
- Story Points: complexity, comprising effort, uncertainty, and risk.
- Velocity is an empirical measure of the productivity of a team in the past.
The goal of any agile team is to achieve optimal velocity: high effectiveness, where it can spend sufficient time on the refactoring and improvement measures.
Maximum velocity can be counterproductive, because it focuses only on short-term success, thus, omitting the activities that help the team in the long-term.
The product owner can use the average velocity of a team to estimate when and how much of the product backlog can be achieved.
The following is important:
- Story points are a team’s individual value (abstract size!) and therefore the velocity of different teams cannot be compared.
- Story points express assumptions about complexity and therefore, cannot be converted into the estimated effort of person days.
Managers rely on metrics, charts, and dashboards. They can assess the degree of project completion or work package in percentage terms. This gives them a sense of security that they so painfully miss in projects (one-time project, complex, time-bound; predictability is, therefore, naturally limited).
With the introduction of agile methods, story points and velocity are misunderstood because redundant or erroneous data is derived from them. Don't do it!
The concept of agile estimation is inherently simple. Let it remain so.
Managers should invest their energies towards taking care of the agile principles in their organization. It helps more if they let their teams self-organize themselves by providing a nurturing environment and helping them solve any problems.
This helps much more in a project’s progress than any measures which contradict the agile ideas.
Representation Velocity
- Planned Story Points : Achieved Story Points
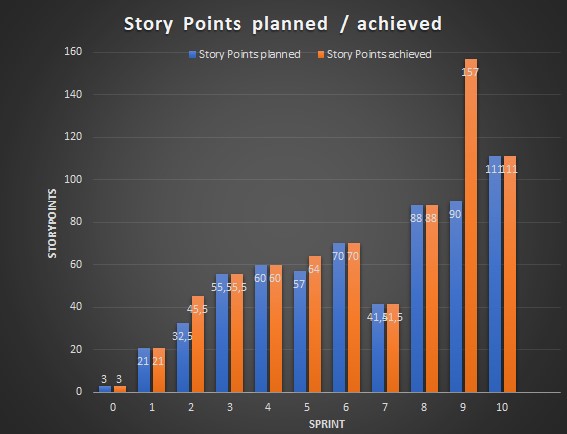 Example: Velocity display
- What is the team planning in the sprint, and what has it achieved?
- The graph shown above displays the maturity level of an agile team and its level of self-organization. It also reflects how successful the team is, in planning and timeboxing user stories.
- It is more meaningful than a chart that shows only the story points achieved.
- It helps to plan the scope of future sprints.
- Story points are counted in only that sprint in which they increase the value of the software (deliverable software).
- They are counted only after completion. For example, in the next sprint, if necessary (which is also planned again there). Velocity balances out on average.
- Remember: Velocity is team-specific, it is not a KPI, and it is not comparable with other teams.
Release Planning
By when can a certain number of release-planned functionalities be implemented?
To know this, we need:
- an estimated backlog (total story points of the affected user stories) and
- the average velocity of the team, with bandwidth, if applicable
We can choose a burn up chart as the representation:
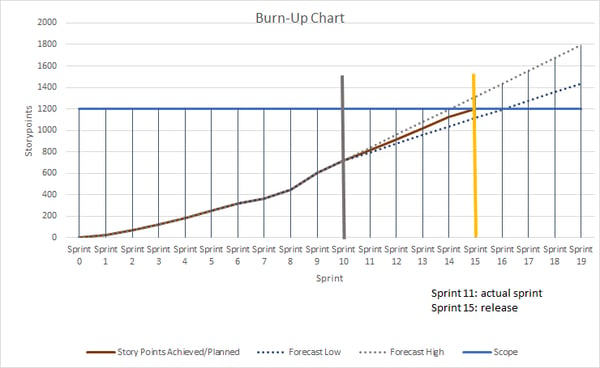
Example of a Burn-Up Chart
- We can see the sprints on the X-axis and the sum of the story points on the Y-axis. The horizontal bar represents the size of the backlog.
- We see the results of the past sprints. How much of the backlog has already been cleared by Sprint X (first vertical bar)?
- We see whether the scope can be implemented up to a planned point in time (second vertical bar). The dotted line from the first vertical bar displays the predicted course, based on the previous average velocity.
- In the example given above, we show the planning with bandwidth, velocity from (forecast low), and velocity to (forecast high).
- The planned release date is Sprint 15. In the best case, we achieve the implementation with Sprint 14, and in the worst case, with Sprint 16.
- Why do we plan with bandwidth?
a) User stories that lie further into the future are less accurate in content and estimation than the stories to be implemented in the next sprint.
b) The sum of the story points per sprint varies by an average. Since it is a best possible approximation, it is more realistic to expect a range: In how many story points does the team normally reach guaranteed (lower limit) and which value is realistic in a "good" sprint (upper limit)?
The product owners can use this tool to plan the next release. All they need is a simple Excel spreadsheet. How does a changed product scope and the adjustment of the prioritization affect the deployment date? Product owners can use it to explain the planning and goals to the development team and work with them to find ways to meet a desired release date. For example: Which change in acceptance criteria reduces the complexity of the extensive user stories and leads to a re-evaluation of the backlog, having a positive effect?
Agility enables flexibility in planning, aligned to business value and build high-performance agile teams. Simple metrics help us to do this.
.png)
